Funnel
The Funnel report shows you exactly how merchants move through your app’s lifecycle - from first discovery to loyal subscriber and beyond. Think of your funnel as a map of your customer’s path - each stage is a unique milestone on their way to becoming a satisfied long-term user.
Beyond basic conversion rates
This report tracks every key step in your customer’s lifecycle:
When they discover your app listing
The instant they click “Install”
When they start their trial
The big win - when they become a subscriber
And the ongoing relationship - upgrades, resubscribes, additional purchases
Understanding your funnel
The story in stages
Each funnel event is distinct and unique. For example, a reinstalled customer won’t appear in the “Installed” event, but will instead show up only in the “Reinstalled” event. This granular tracking gives you a clear picture of each customer’s individual path.
Those percentage changes between stages show you exactly where to focus your optimization efforts.
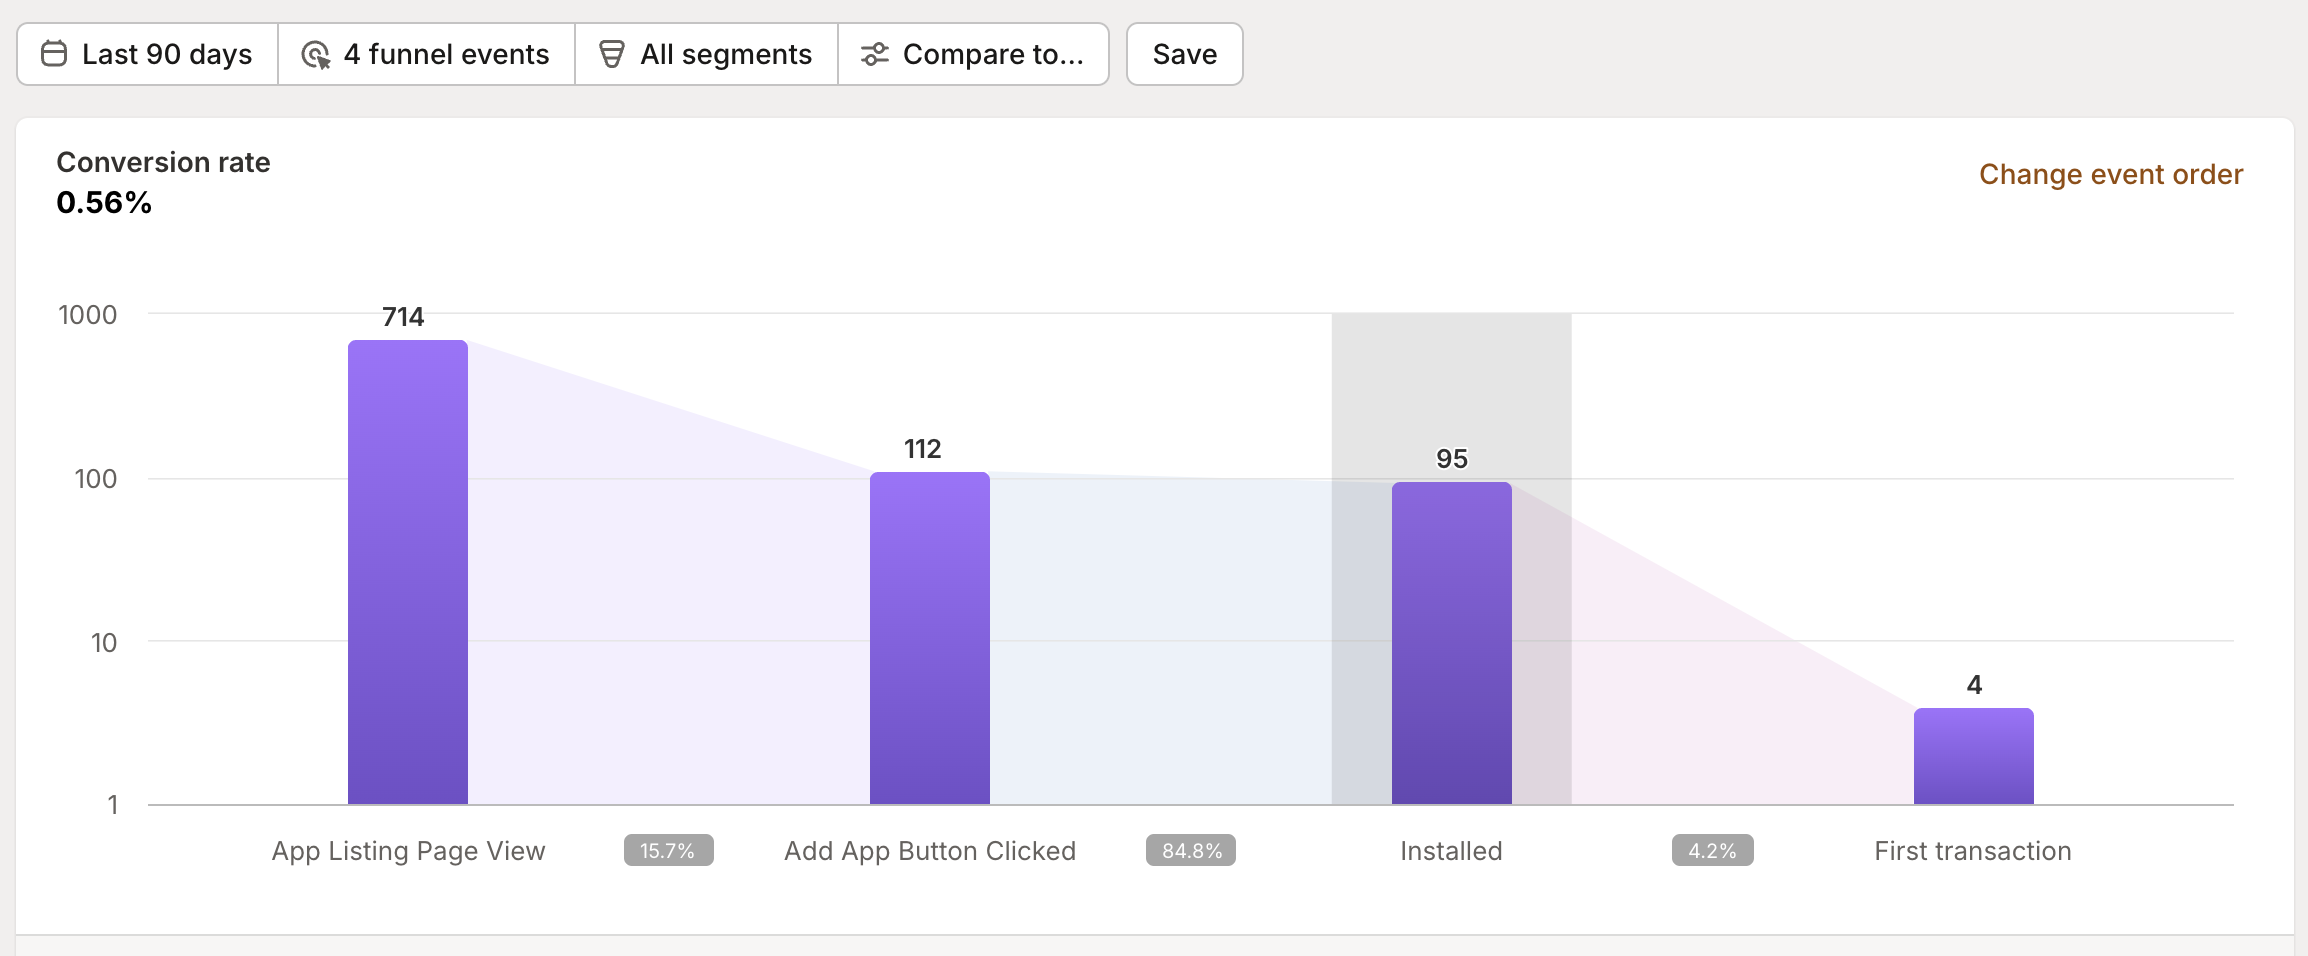
Your funnel visualization shows the critical touch points:
App listing page views - merchants who discovered your app
Add app button clicked - merchants who showed interest
Installed - merchants who installed your app
Trial started - merchants who started a trial
Trial converted - merchants who converted from trial to paid
Subscribed - merchants who became subscribers
Unsubscribed - merchants who ended their subscription
Reinstalled - merchants who reinstalled after uninstalling
Resubscribed - merchants who resubscribed after a period of inactivity
Upgraded - merchants who upgraded to a higher tier
Downgraded - merchants who downgraded to a lower-cost plan
One-time charges - merchants who made one-time purchases
The numbers change at each stage, telling you something about how merchants perceive your app’s value - and where you have opportunities to improve their experience.
Diving into the details
The real power lies in the ability to click into each event and see the individual customers who make up these numbers. From there, you can dive into each customer’s profile to see their unique timeline of events and how they map to their progression through your funnel. This granular view turns abstract data points into actionable insights about real customer behavior.
Tracing individual customer paths through your funnel gives you insight into where merchants find value - and where you could make your app even more essential.
Custom usage events in your funnel
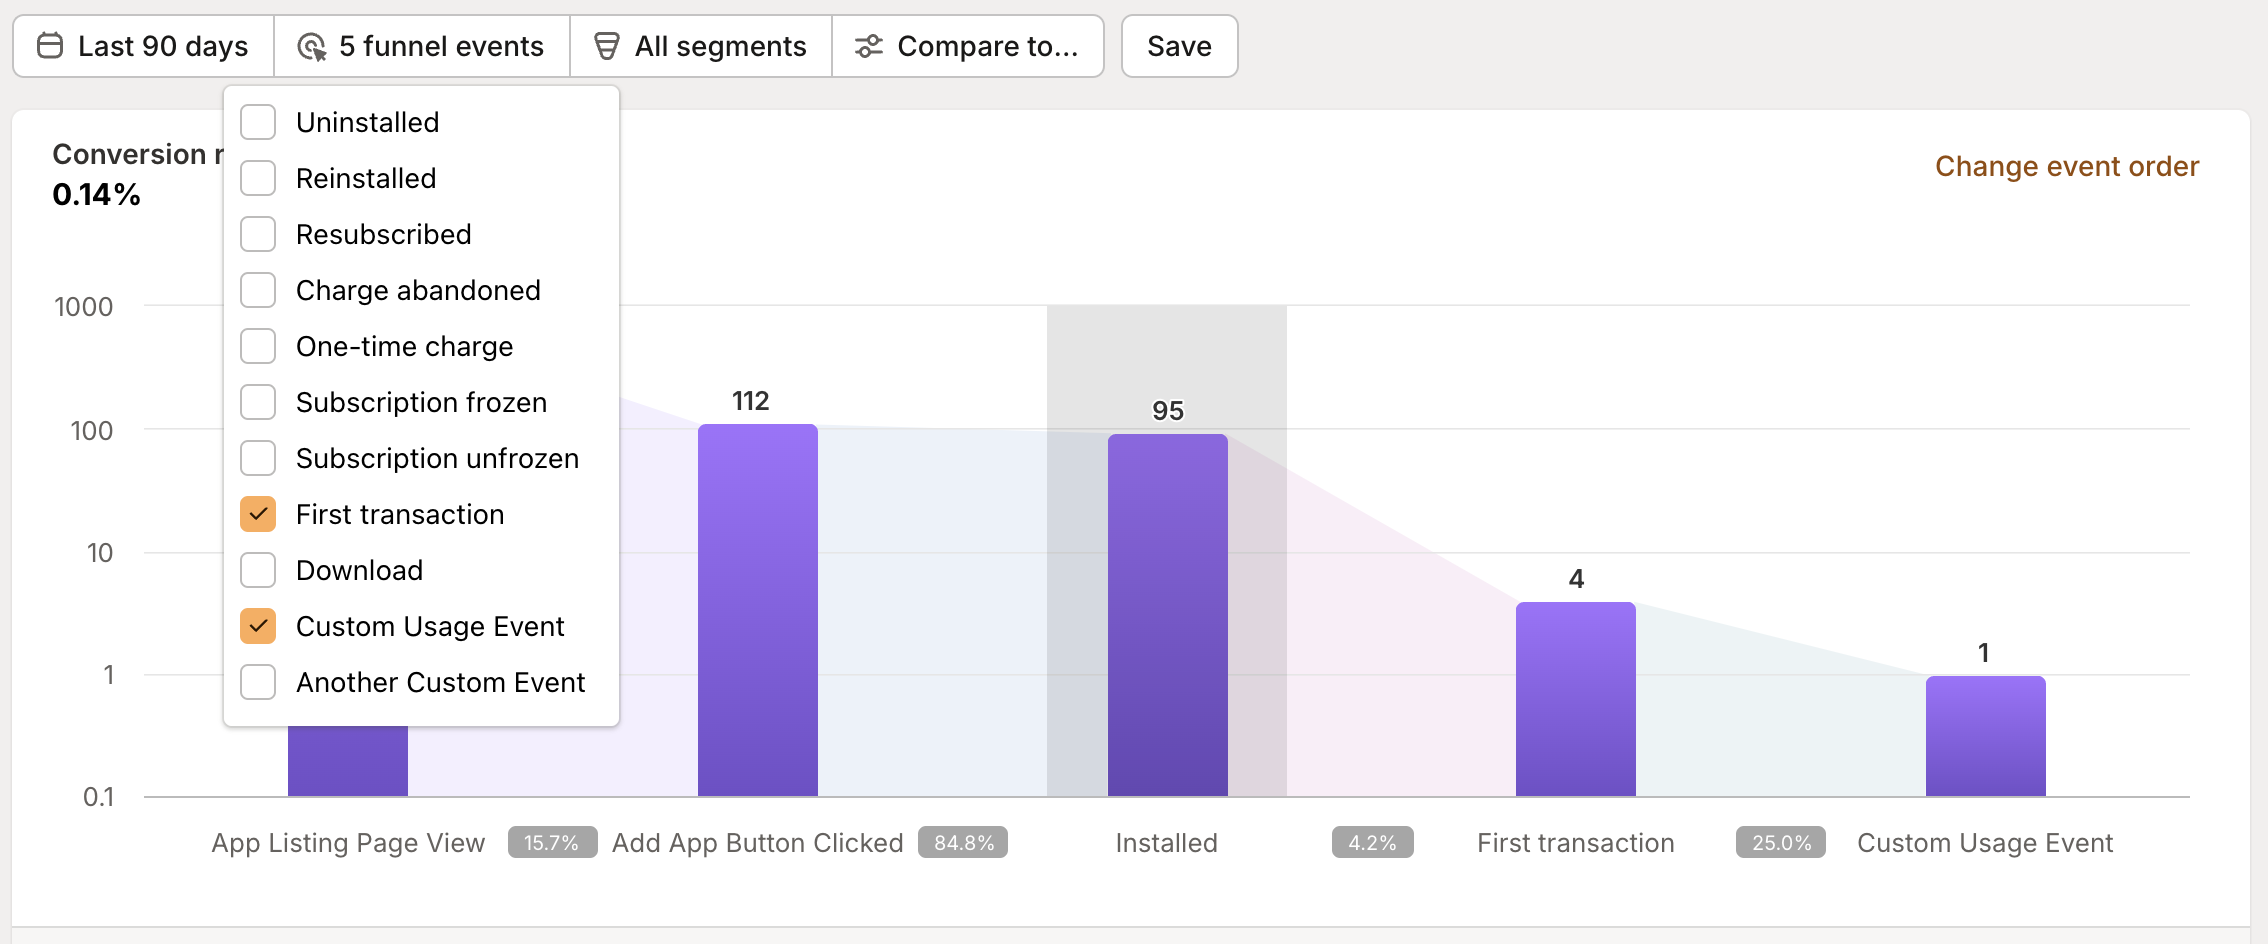
The standard funnel stages paint a clear picture of your customer’s journey, but your app’s unique features and workflows deserve their own place in that story. Mantle’s usage events let you add any trackable customer action to your funnel analysis, integrating them seamlessly with platform events.
Adding usage events to your funnel means tracking:
Key feature activations
Important customer milestones
Specific workflow completions
New feature adoption
These custom events appear right alongside the standard funnel stages, transforming generic platform data into a funnel that truly represents your customer’s journey with your app. Each usage event you track adds another layer of insight into how merchants engage with your unique features and value propositions.
By connecting usage data directly to your funnel, you’ll see exactly how specific features and actions influence customer progression. This combined view helps identify which features drive conversion, what successful customers do differently, and where you might have opportunities to improve engagement.
The implementation guide in our usage events documentation walks through the technical details of sending these events to Mantle.
Measuring your funnel
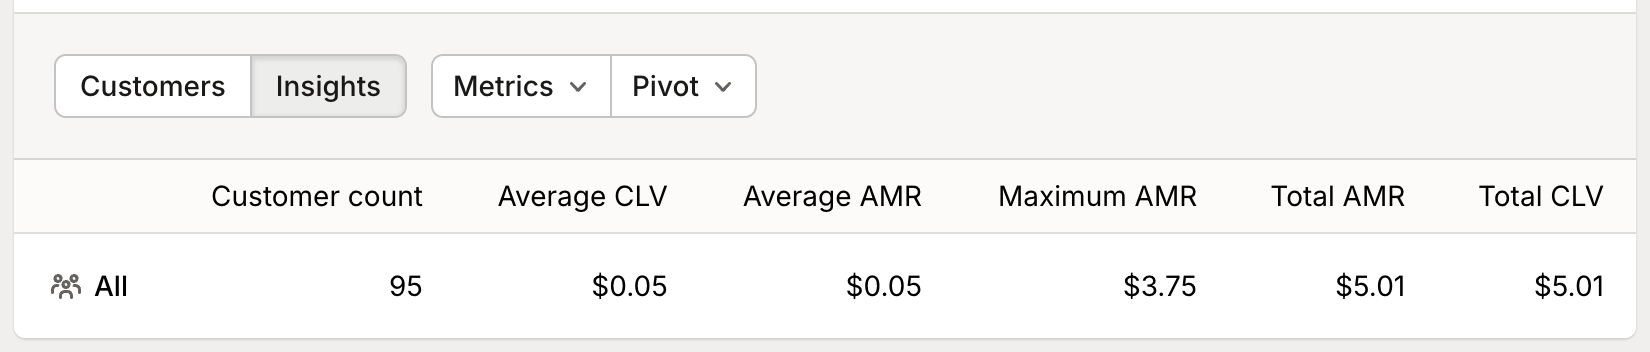
Average CLV (Lifetime value)
Total CLV from each stage
Average AMR (Average revenue per user)
Maximum AMR
Total AMR
These numbers reveal not just who converts, but who gets the most value from your app over time. Use these insights to fine-tune your pricing and packaging to attract more high-value users.
📊 Metrics that matter
While every number tells a story, these are the top three to watch:
Overall conversion rate: The percentage of app listing visitors who become subscribers. This is your big-picture health indicator.
Trial to paid conversion rate: How many trialists turn into paying customers? This shows the stickiness of your app.
Upgrades vs downgrades: The ratio of users moving up and down your pricing tiers. This helps gauge your tiers’ value alignment.
Making sense of your data
Analyzing your funnel
The funnel can be analyzed through multiple dimensions:
App: See how different parts of your product perform. Great for prioritizing development efforts.
Shopify plan: Compare conversion rates across merchant tiers. Understand how different segments behave.
Tags: Track specific customer segments. Spot patterns among your most engaged users.
Industry: Find your most promising market segments. Tailor your messaging and features accordingly.
Country: Understand geographical trends. Identify top markets and spot localization opportunities.
Uninstall reason: Learn why some merchants leave. Turn churn insights into product improvements.
These filters help you spot patterns in your most successful full-funnel conversions.
Pro tips for funnel analysis
Here are some effective ways to get more from your funnel data:
Compare changes: Look at how your funnel performs before and after product updates or pricing changes
Track features: See how specific features influence customer progression through your funnel
Monitor timing: Understand how long customers spend in each stage, especially during trials
Study groups: Look at how different cohorts of customers move through your funnel over time
What your funnel reveals
Your funnel data tells you:
Which stages need attention (look for big drop-offs)
How different segments behave in your funnel
Which customer types are most likely to convert
What makes certain users more valuable than others
Where you’re losing potential long-term customers
Every gap between stages is an opportunity to enhance your users’ experience and keep them engaged.
The Funnel report helps you understand your customer’s complete lifecycle, from first touch to long-term loyalty. Dive in and explore the individual customer stories behind the data.