Helpdesk Reporting
Find it at Reports → Tickets in your Mantle dashboard.
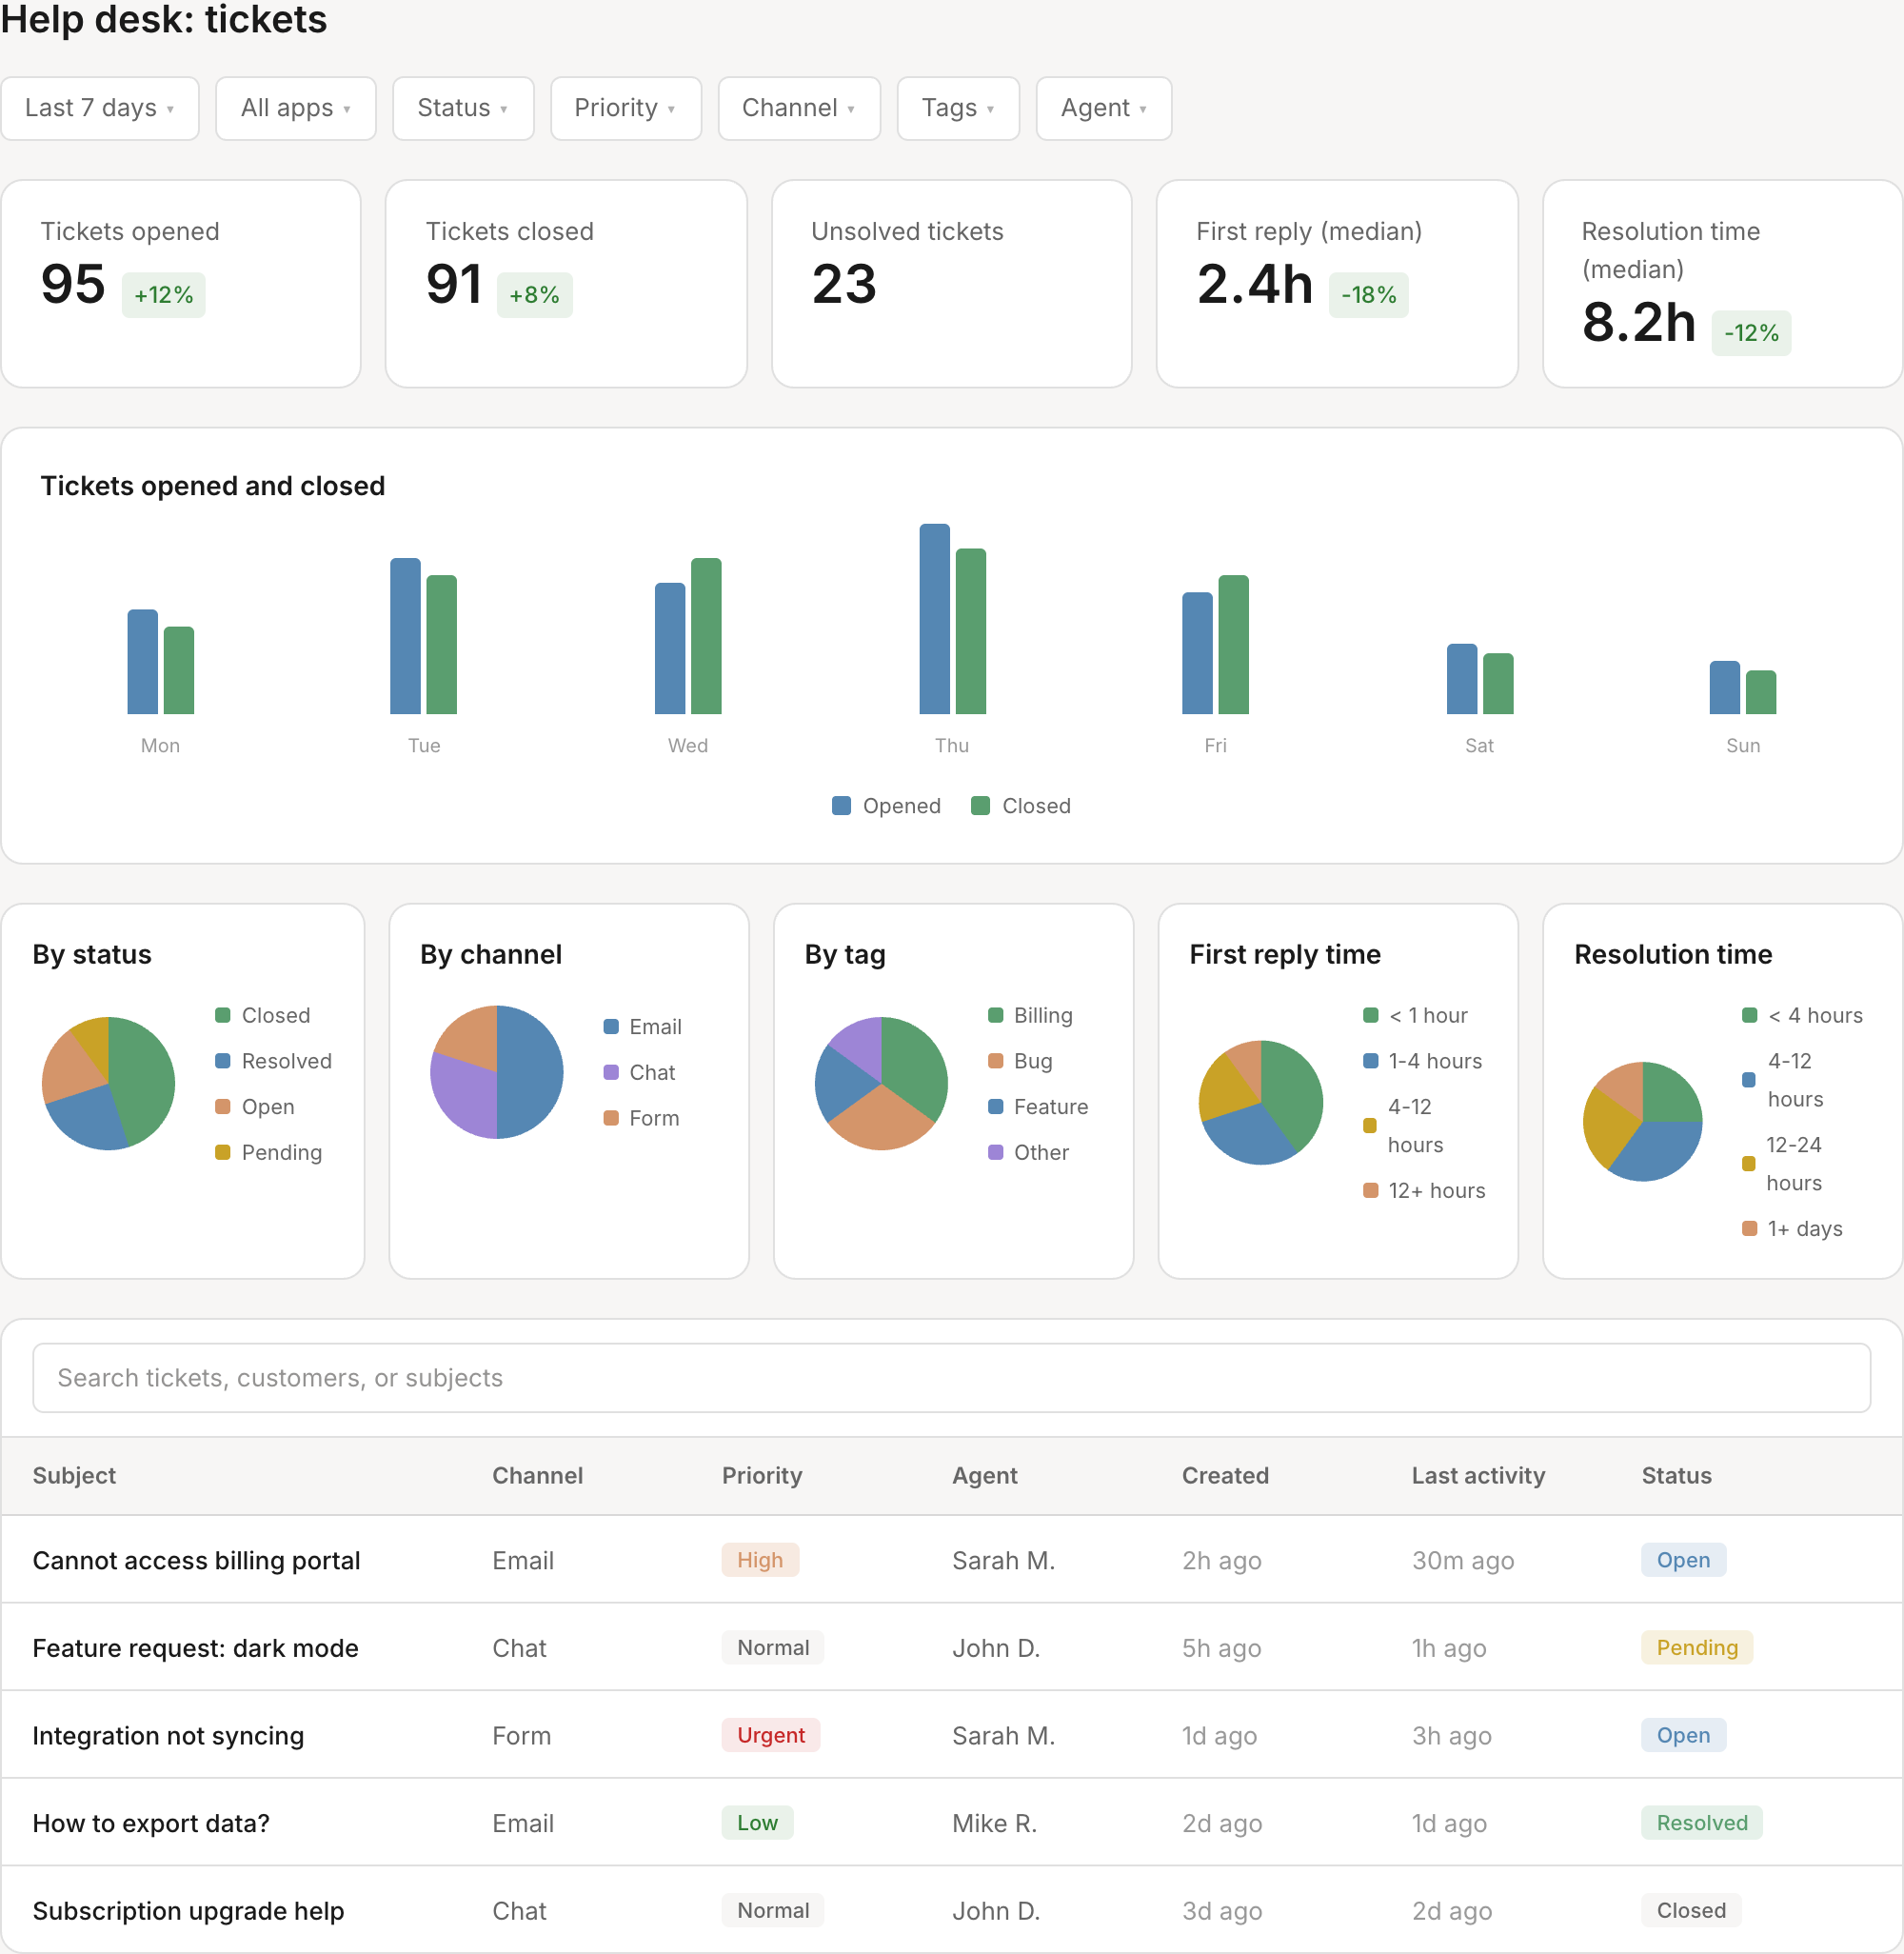
Key metrics
At the top of the report, you'll see five summary stats comparing your selected period to the previous period:
| Metric | What it tells you |
|---|---|
| Tickets Opened | Total new tickets created in the period. Rising numbers may indicate product issues or growth. |
| Tickets Closed | Total tickets resolved. Compare to opened to see if you're keeping up with demand. |
| Unsolved Tickets | Current backlog of open and pending tickets. This is a real-time count, not period-specific. |
| First Reply (Median) | How quickly your team sends the first response. Lower is better — customers notice fast replies. |
| Resolution Time (Median) | How long it takes to fully resolve tickets. Tracks end-to-end customer experience. |
Filtering your data
Use the filters at the top of the report to drill down into specific segments:
- Date range — Select start and end dates for your analysis
- App — Filter by a specific connected app (useful if you support multiple products)
- Status — Focus on Open, Pending, Resolved, or Closed tickets
- Priority — Filter by Low, Normal, High, or Urgent
- Channel — See tickets from specific channels (email, chat, form, etc.)
- Tags — Filter by ticket tags you've assigned
- Assigned agent — View tickets handled by a specific team member
- Customer segment — Filter by customer segments you've defined
Charts and visualizations
The report includes several charts to help you spot trends and patterns:
Tickets opened vs closed
A daily bar chart showing how many tickets were opened and closed each day. Look for:
- Days where opened exceeds closed (backlog growing)
- Spikes that might correlate with product releases or issues
- Weekly patterns (e.g., Monday surges)
Tickets by status
Pie chart showing the distribution across Open, Pending, Resolved, and Closed. A healthy queue typically has most tickets in Resolved/Closed states.
Tickets by channel
See where your tickets are coming from — email, live chat, contact forms, or other channels. This helps you prioritize channel improvements and staffing.
Tickets by tag
Shows which tags appear most frequently. Useful for identifying common issue categories or feature requests.
First reply time distribution
Breaks down your first response times into buckets:
- Under 1 hour
- 1–4 hours
- 4–12 hours
- 12–24 hours
- Over 24 hours
Aim to shift tickets toward the faster buckets over time.
Resolution time distribution
Similar breakdown for total resolution time:
- Under 4 hours
- 4–12 hours
- 12–24 hours
- 1–3 days
- Over 3 days
Tickets table
Below the charts, you'll find a searchable, sortable table of individual tickets. Use this to:
- Search by ticket number, customer name, or subject
- Sort by any column (click the header)
- Click through to individual tickets for more detail
The table shows:
- App
- Channel type
- Priority
- Assigned agent
- Created date
- Last activity
- Status
Related reports
Mantle includes additional reports for deeper support analytics:
- Agent Performance — Compare individual agent metrics and see leaderboards
- Support Operations — Real-time queue health, at-risk tickets, and volume trends
- SLA Compliance — Track performance against your service level agreements